Compass

Blog

South Lake Tahoe Real Estate Report October 2021

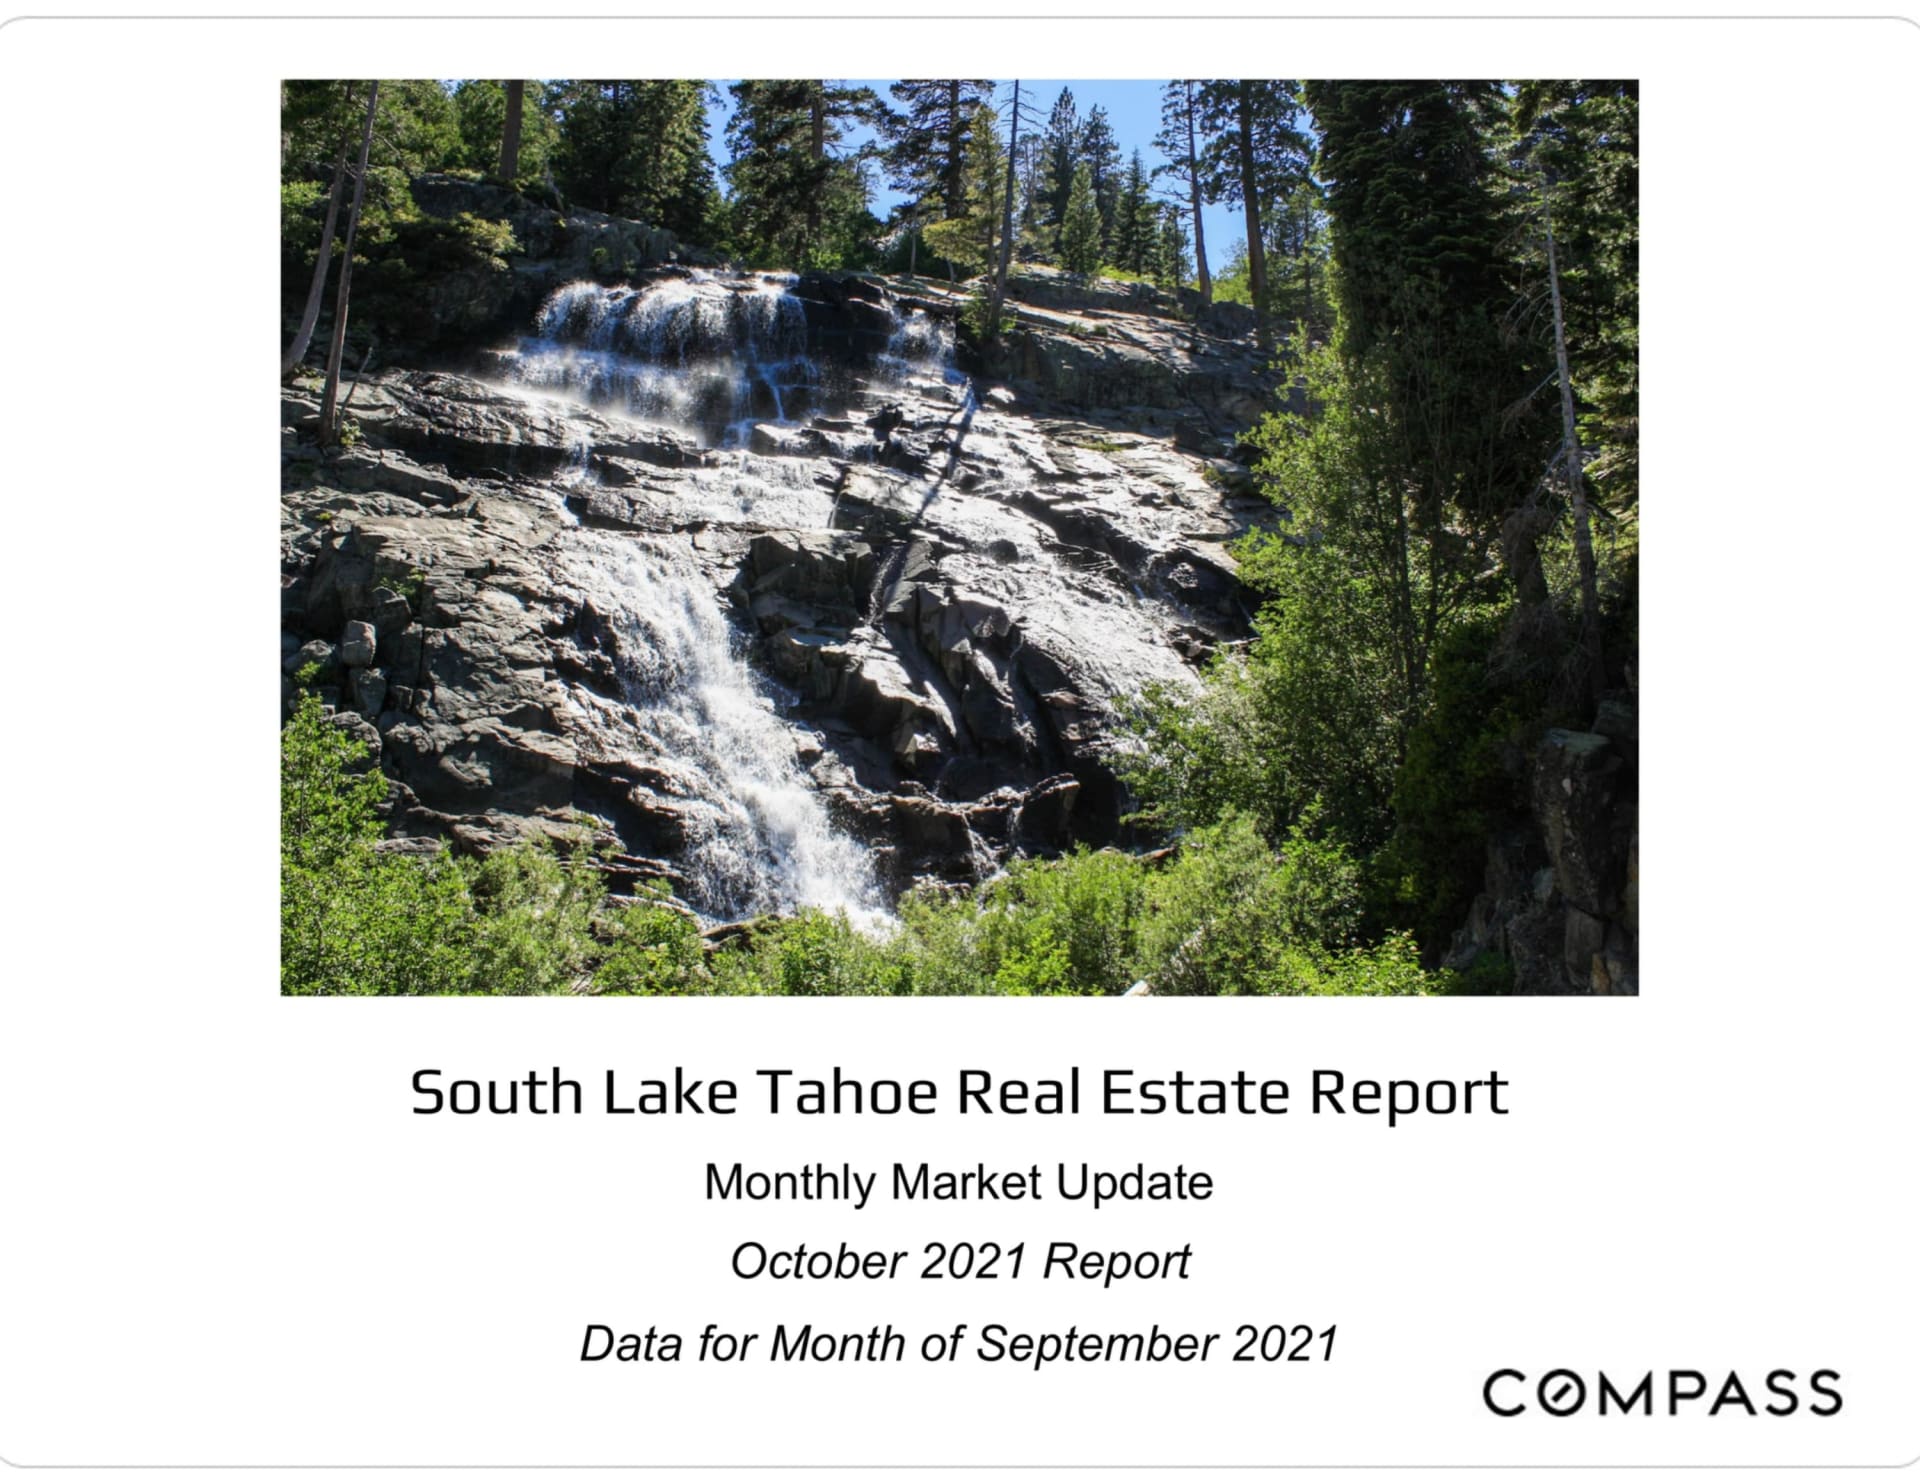
South Lake Tahoe Real Estate Report, October 2021 monthly market update

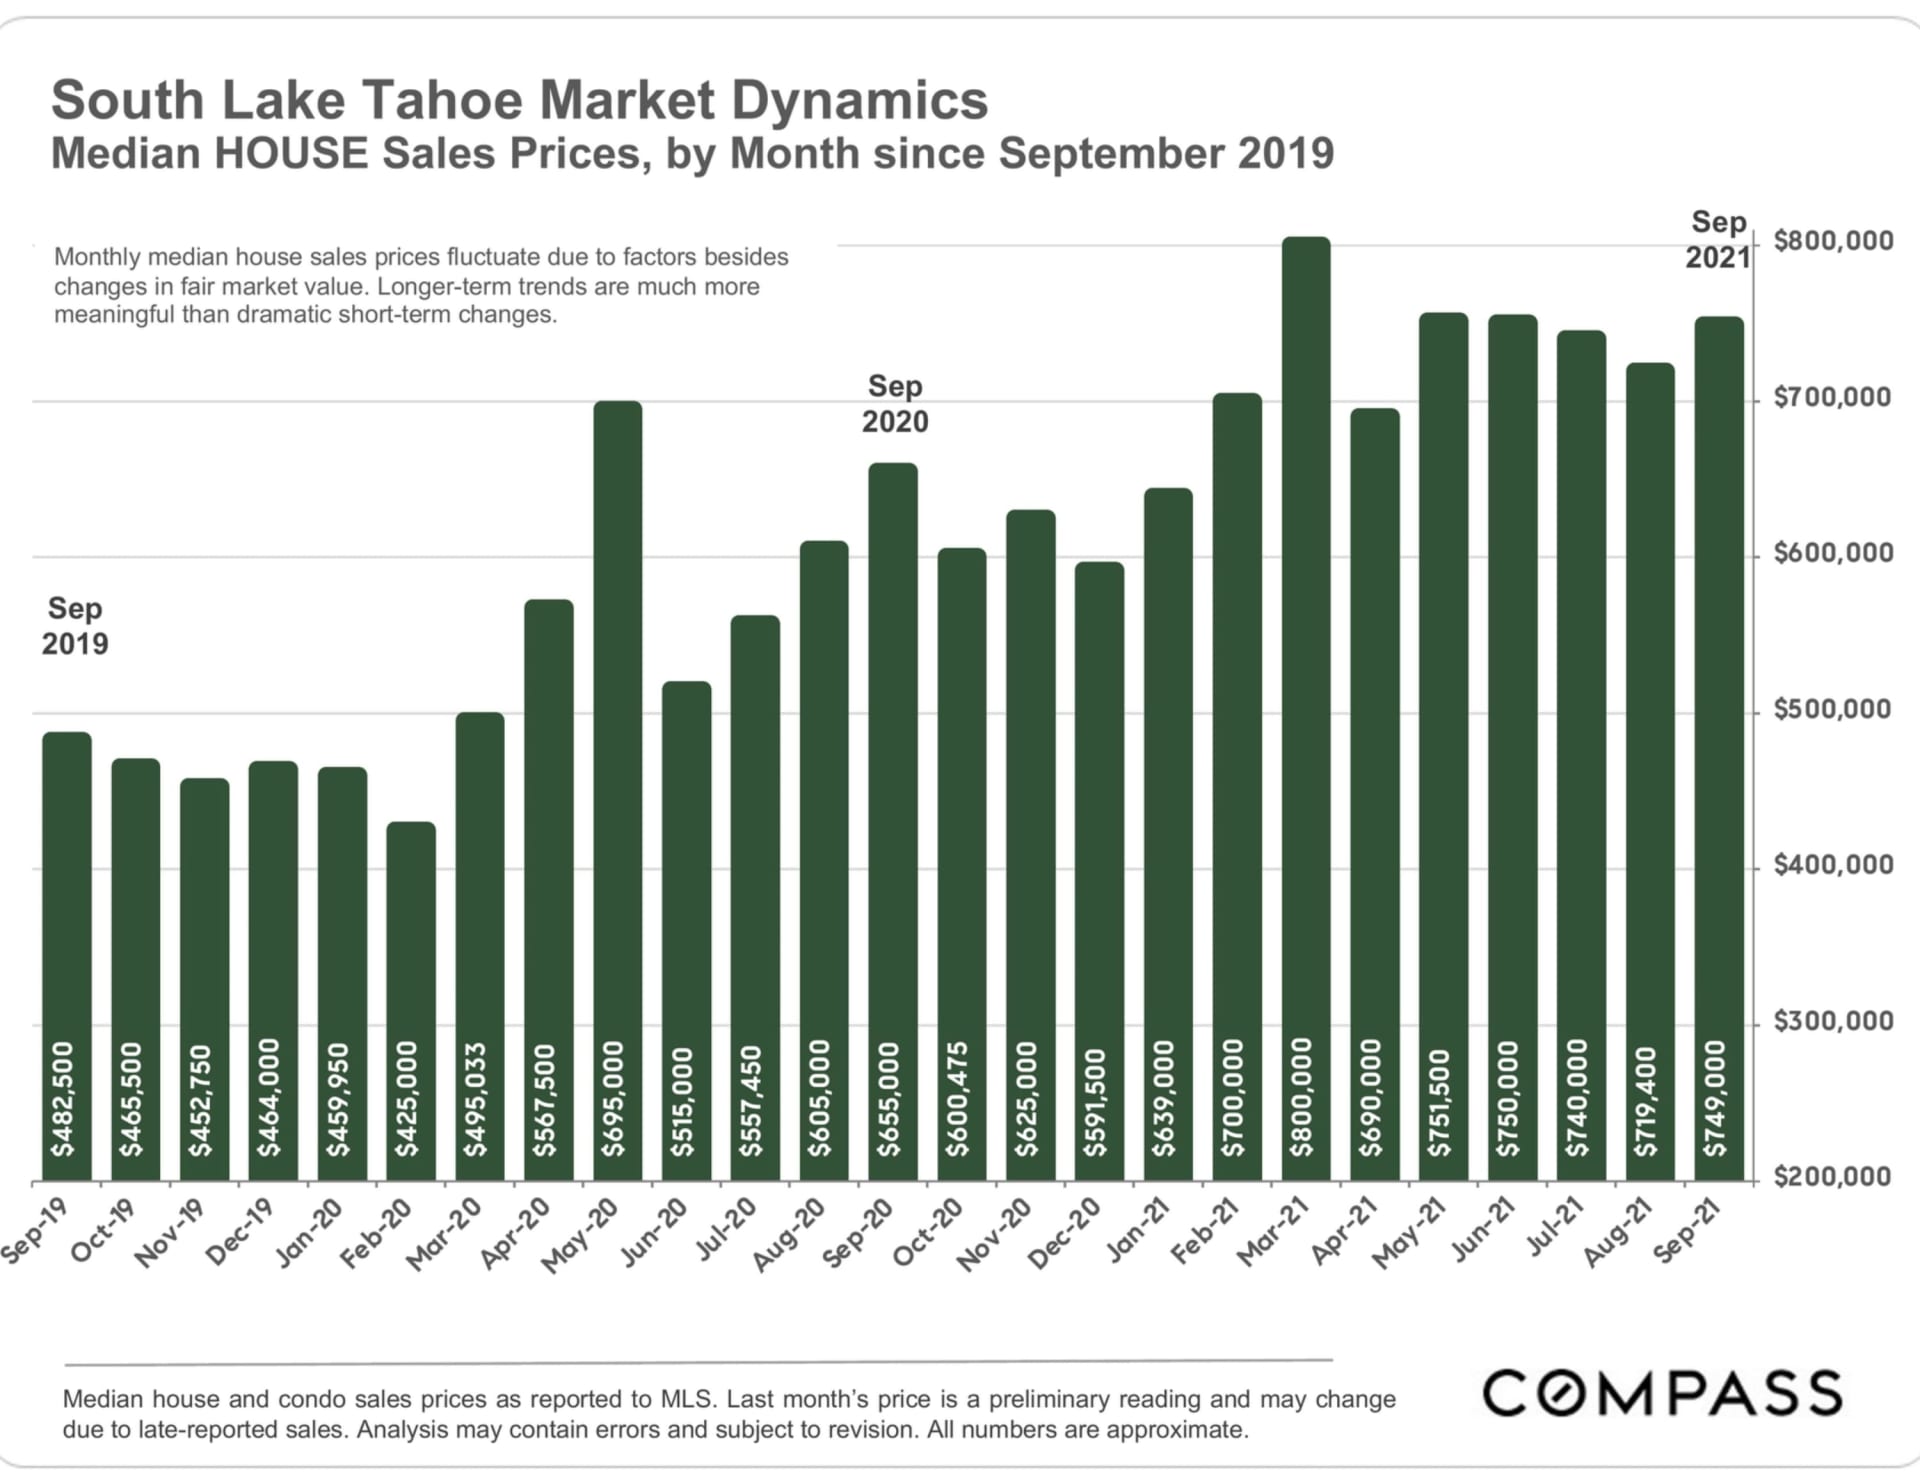
Bar chart of South Lake Tahoe median house prices, rising from $482,500 in September 2019 to $749,000 in September 2021.

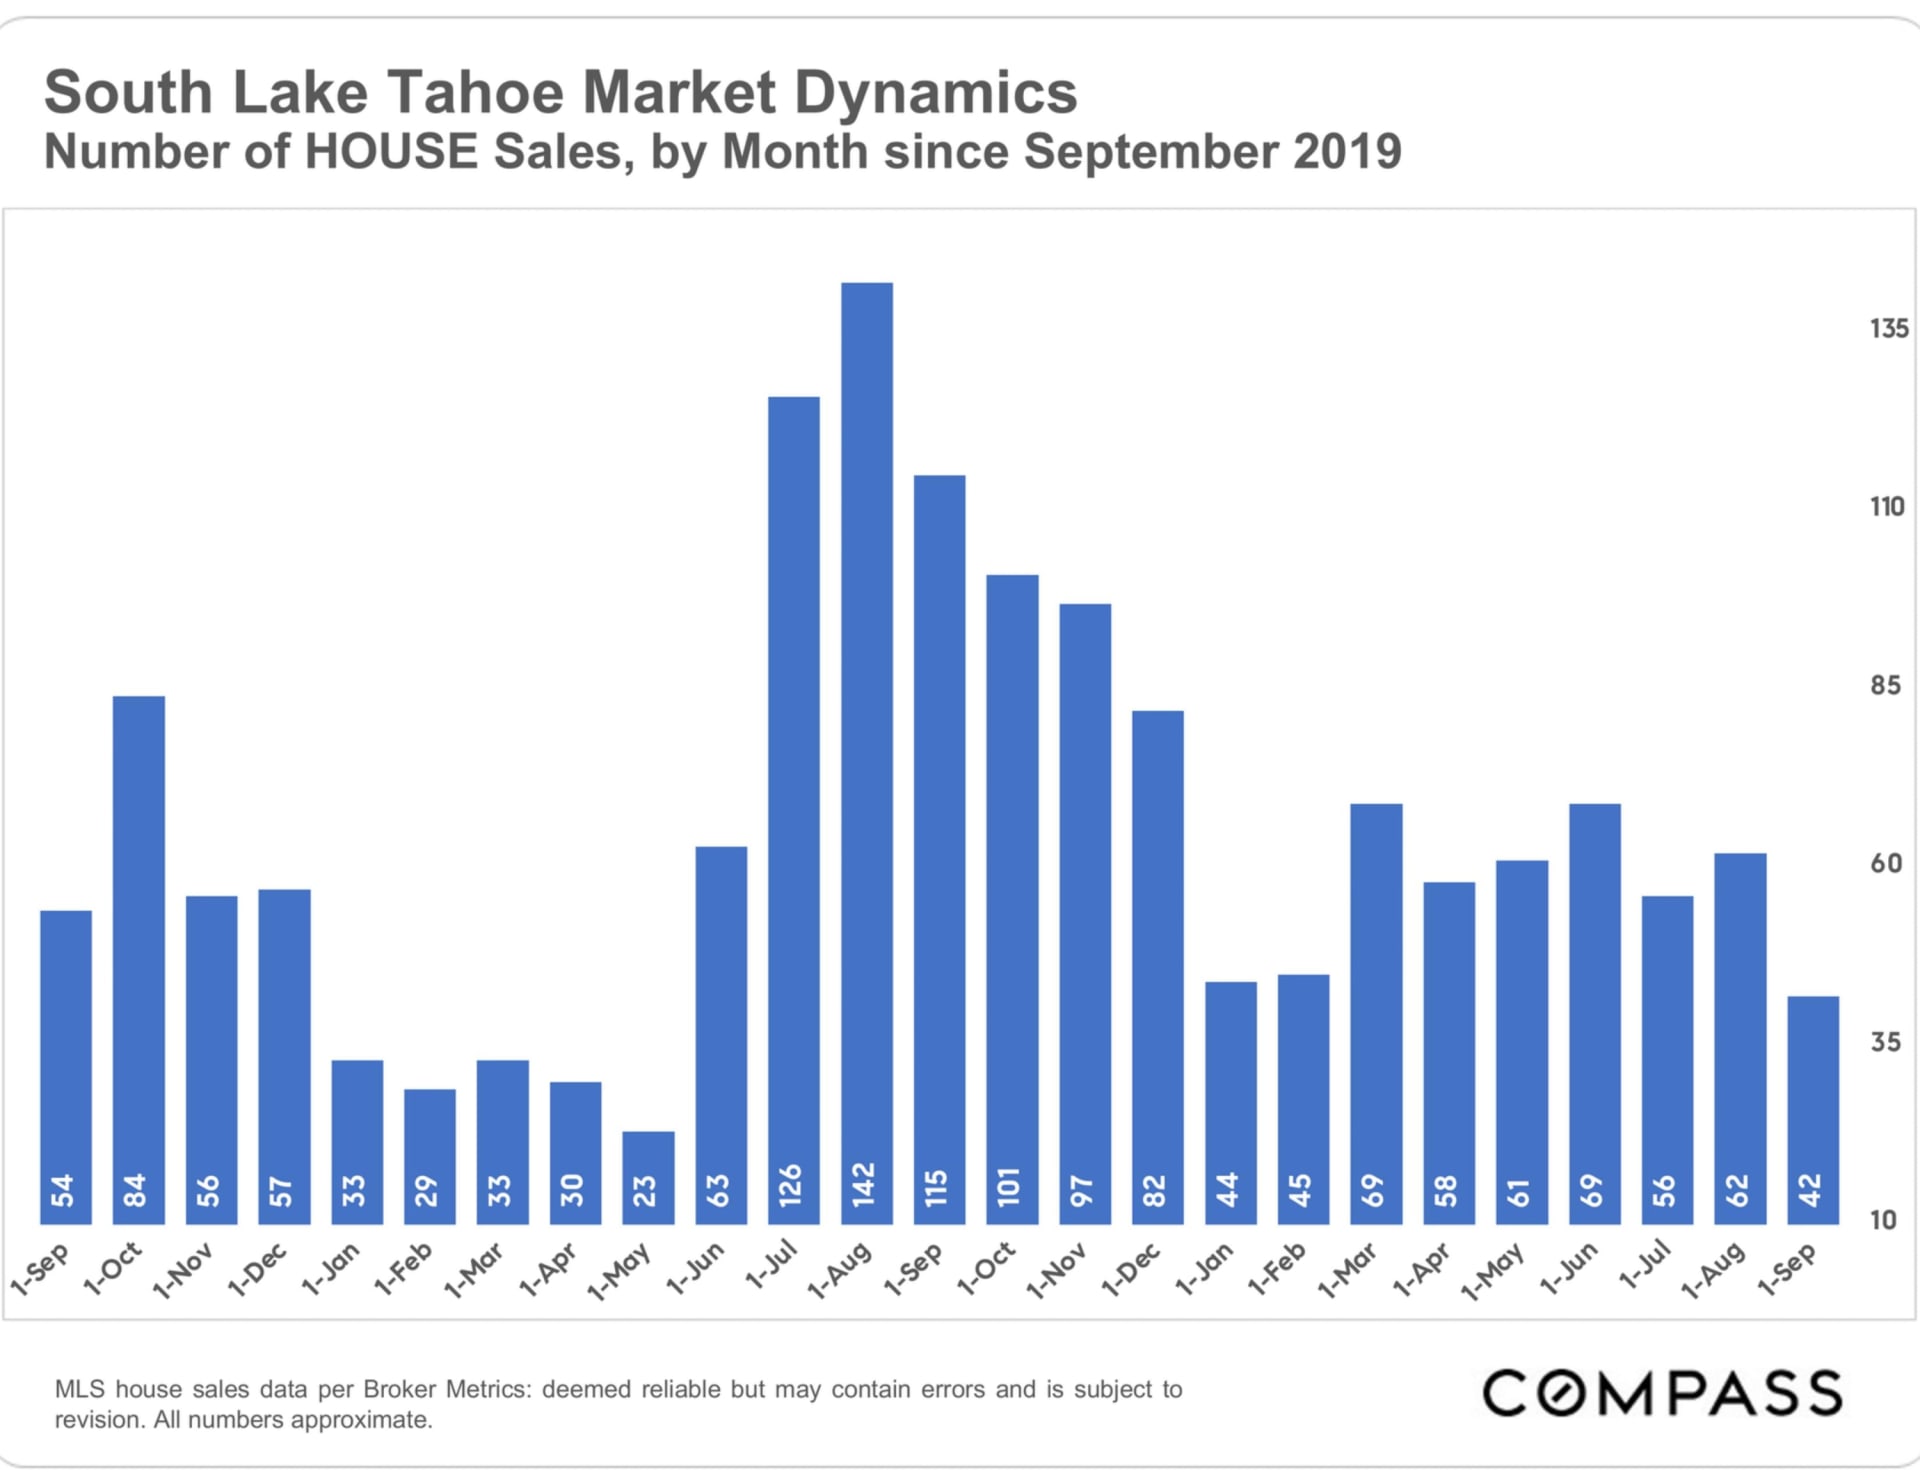
Bar chart of monthly South Lake Tahoe house sales, peaking at 142 in August 2020 and showing 42 in September 2021.

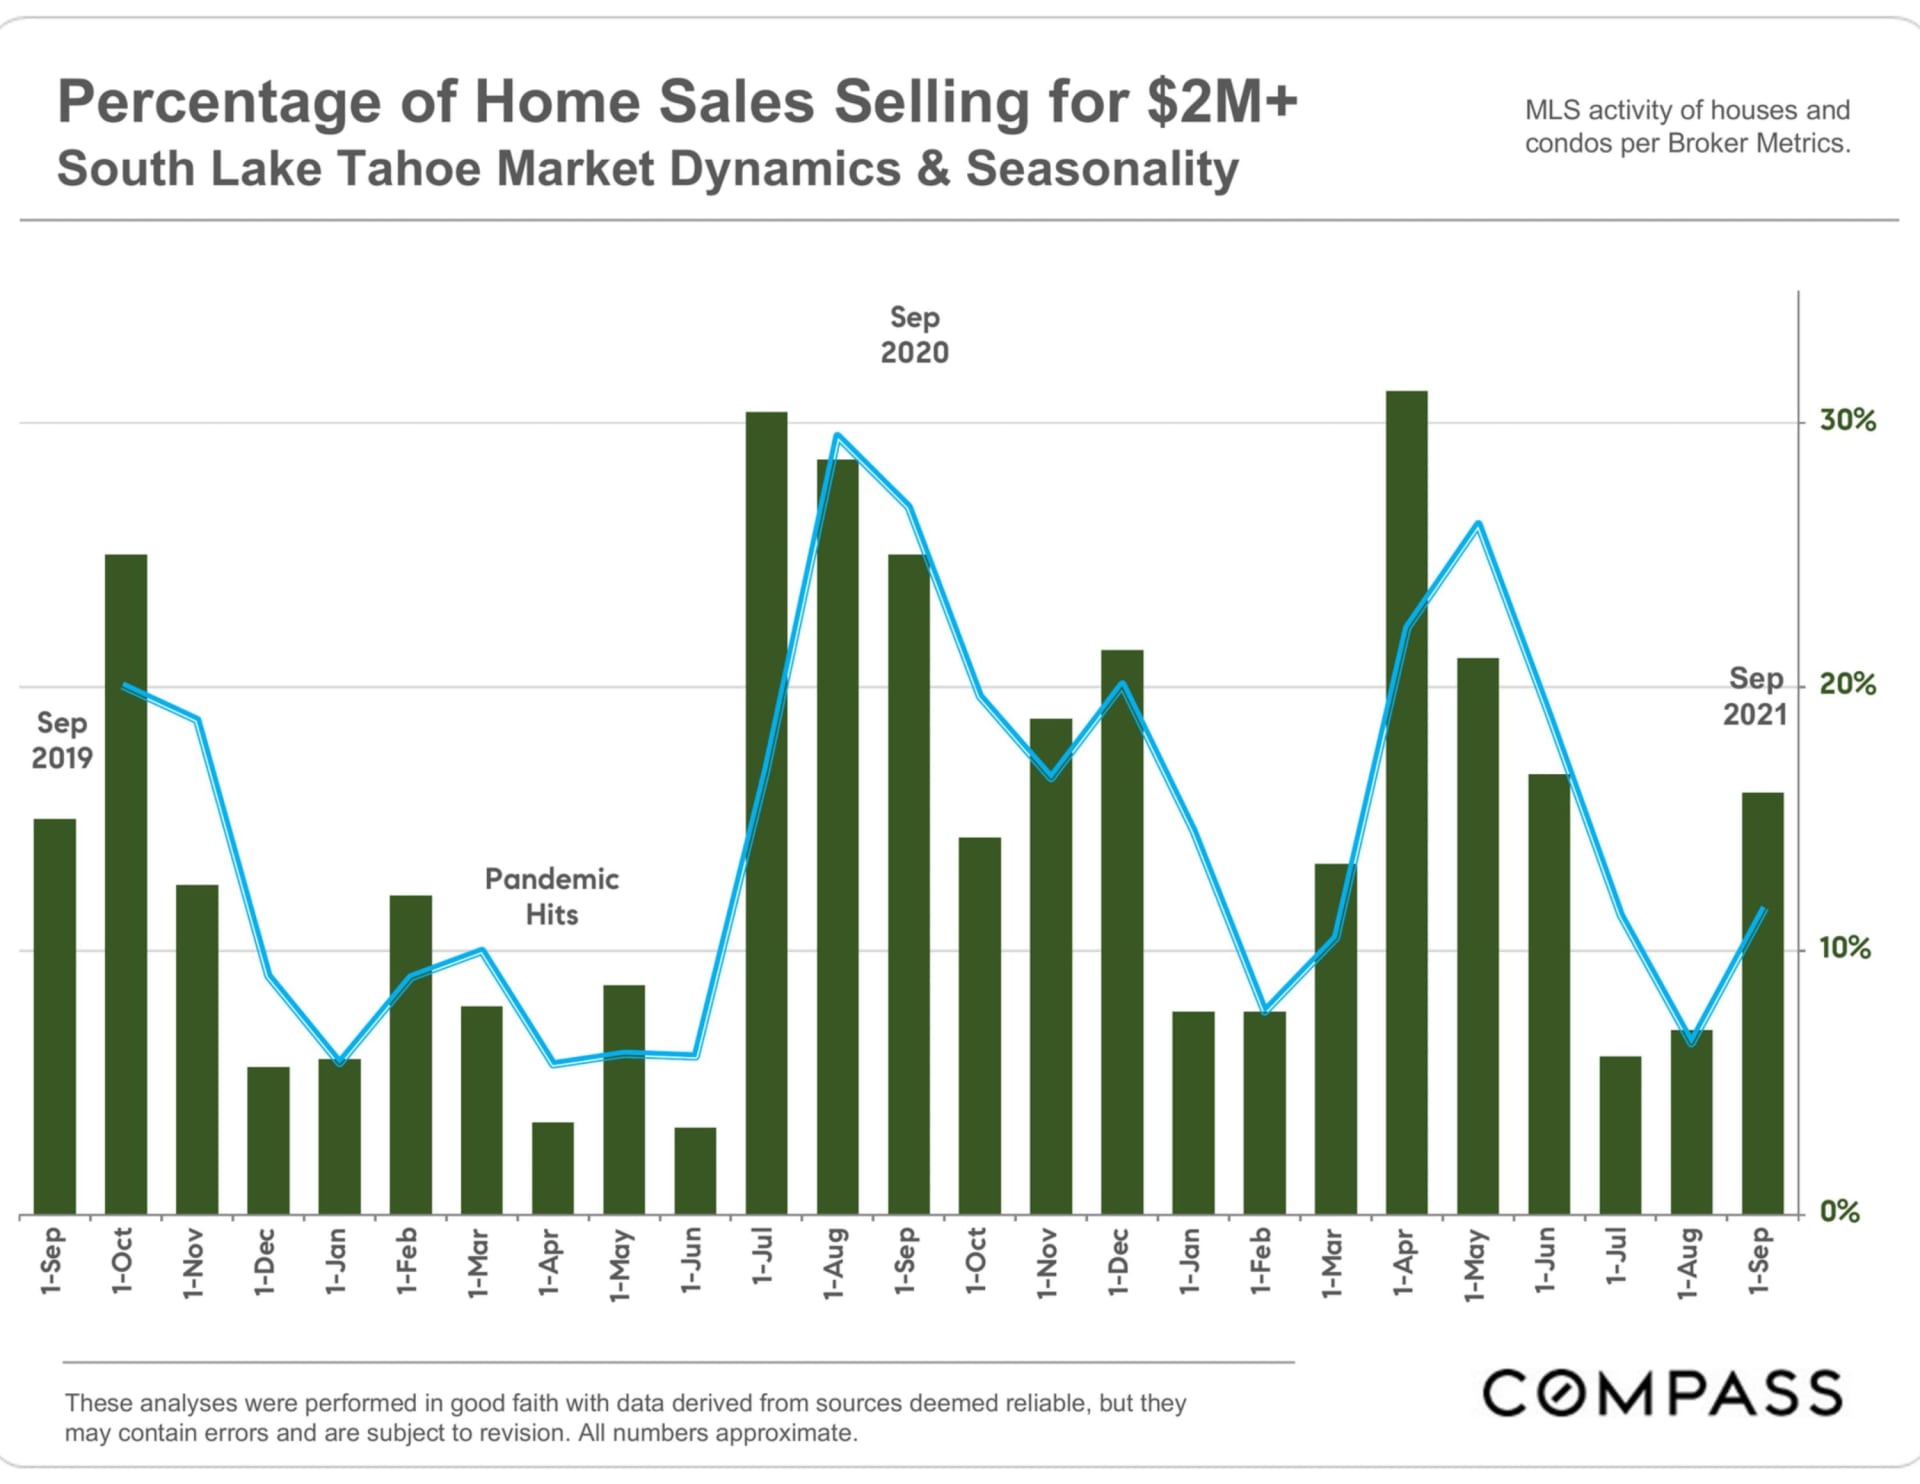
Chart of South Lake Tahoe home sales over $2 million, with monthly bars and a blue trend line from 2019 to 2021.

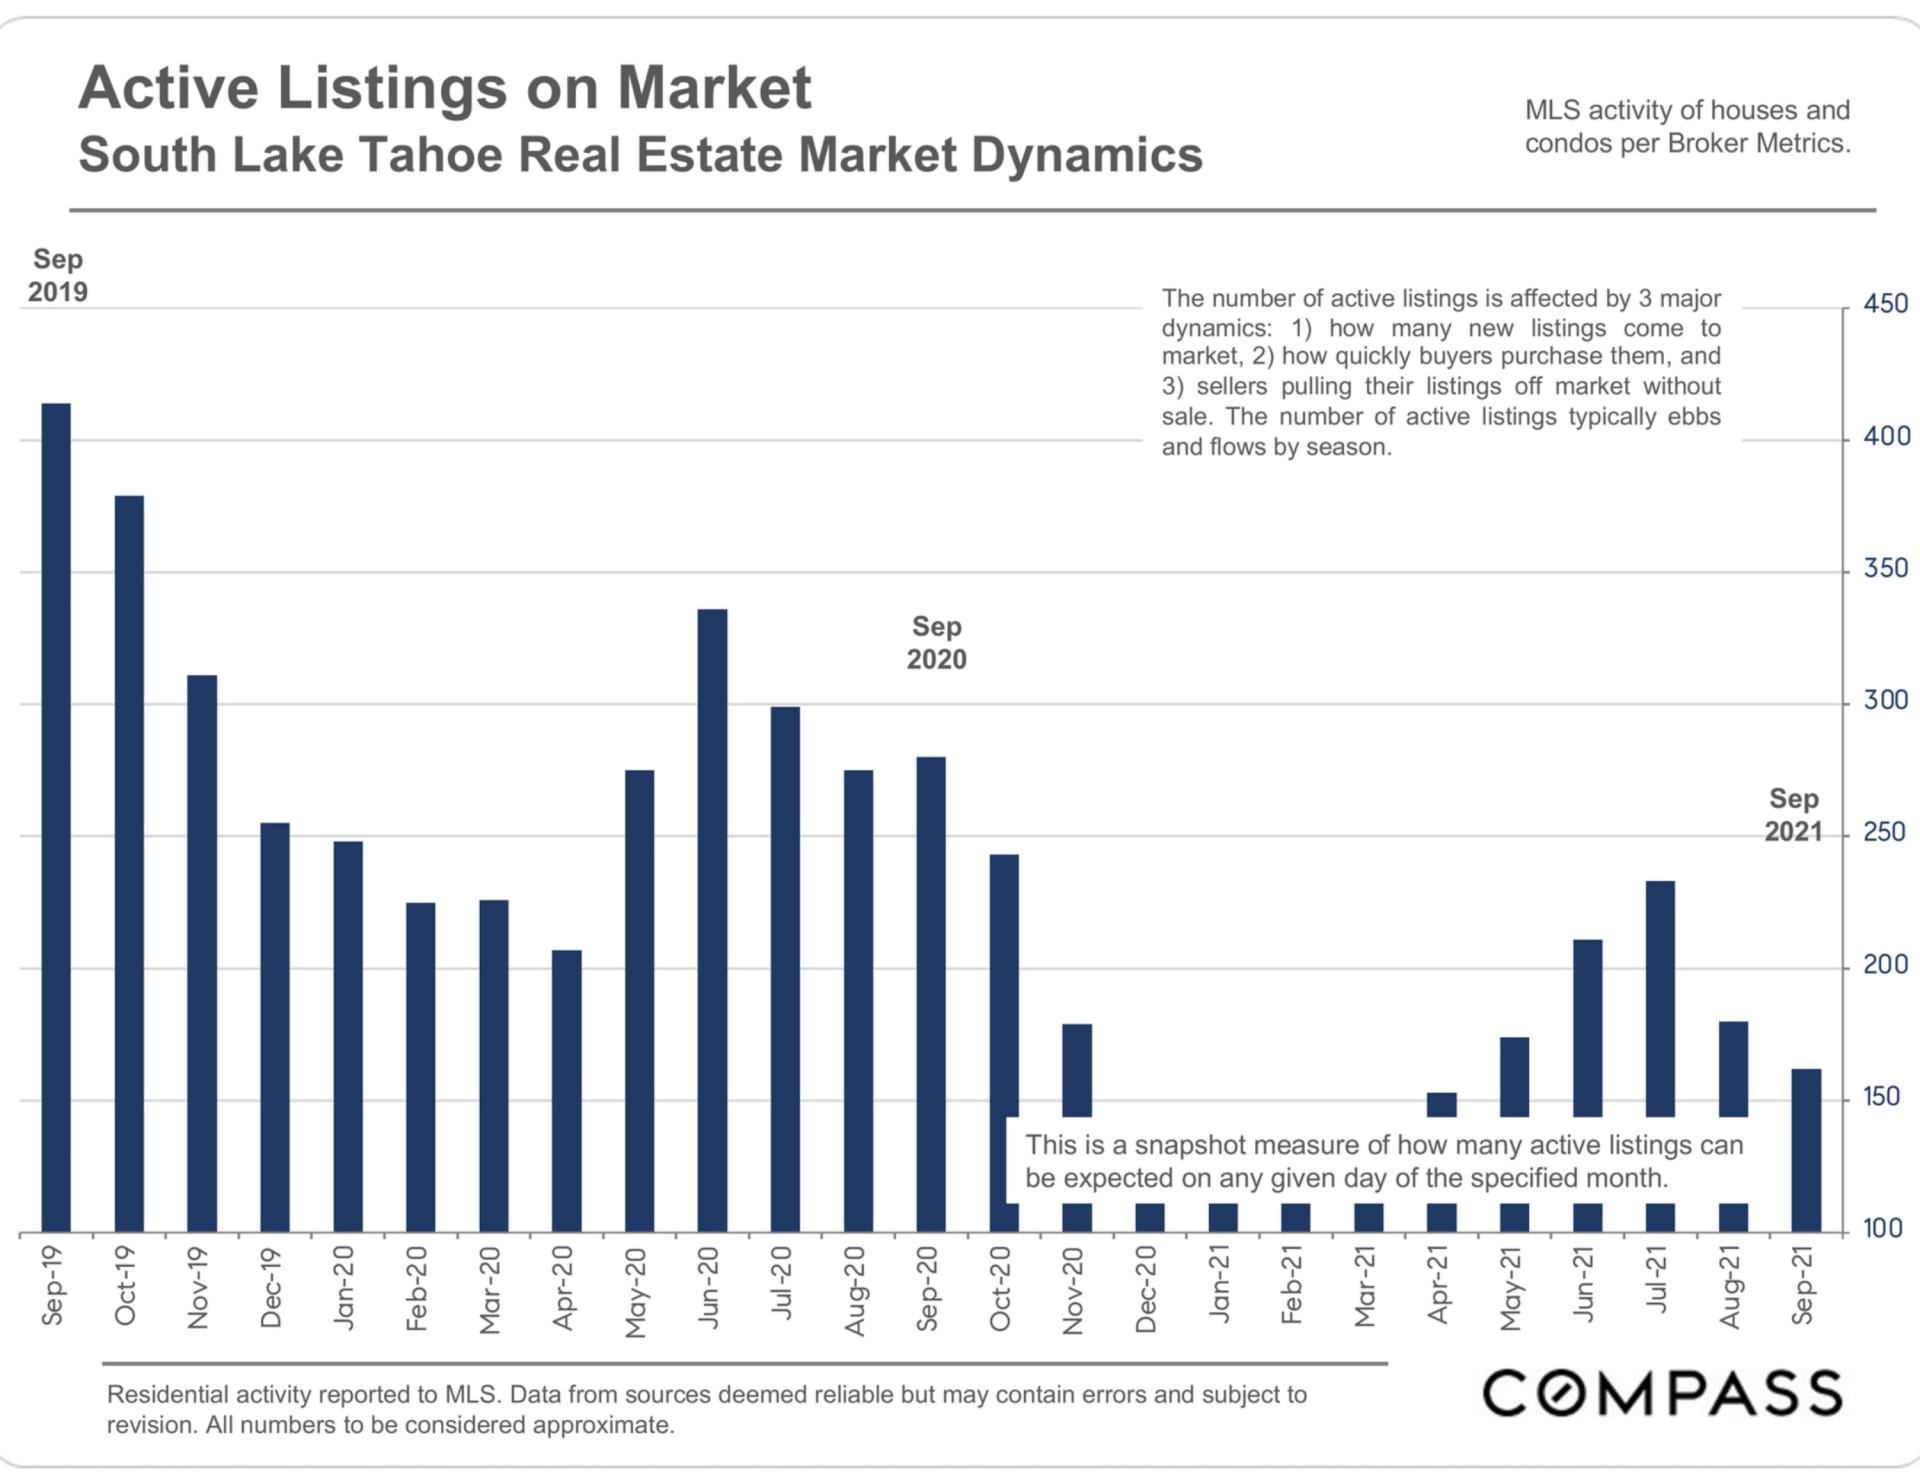
Bar chart of active South Lake Tahoe real estate listings from September 2019 to September 2021.

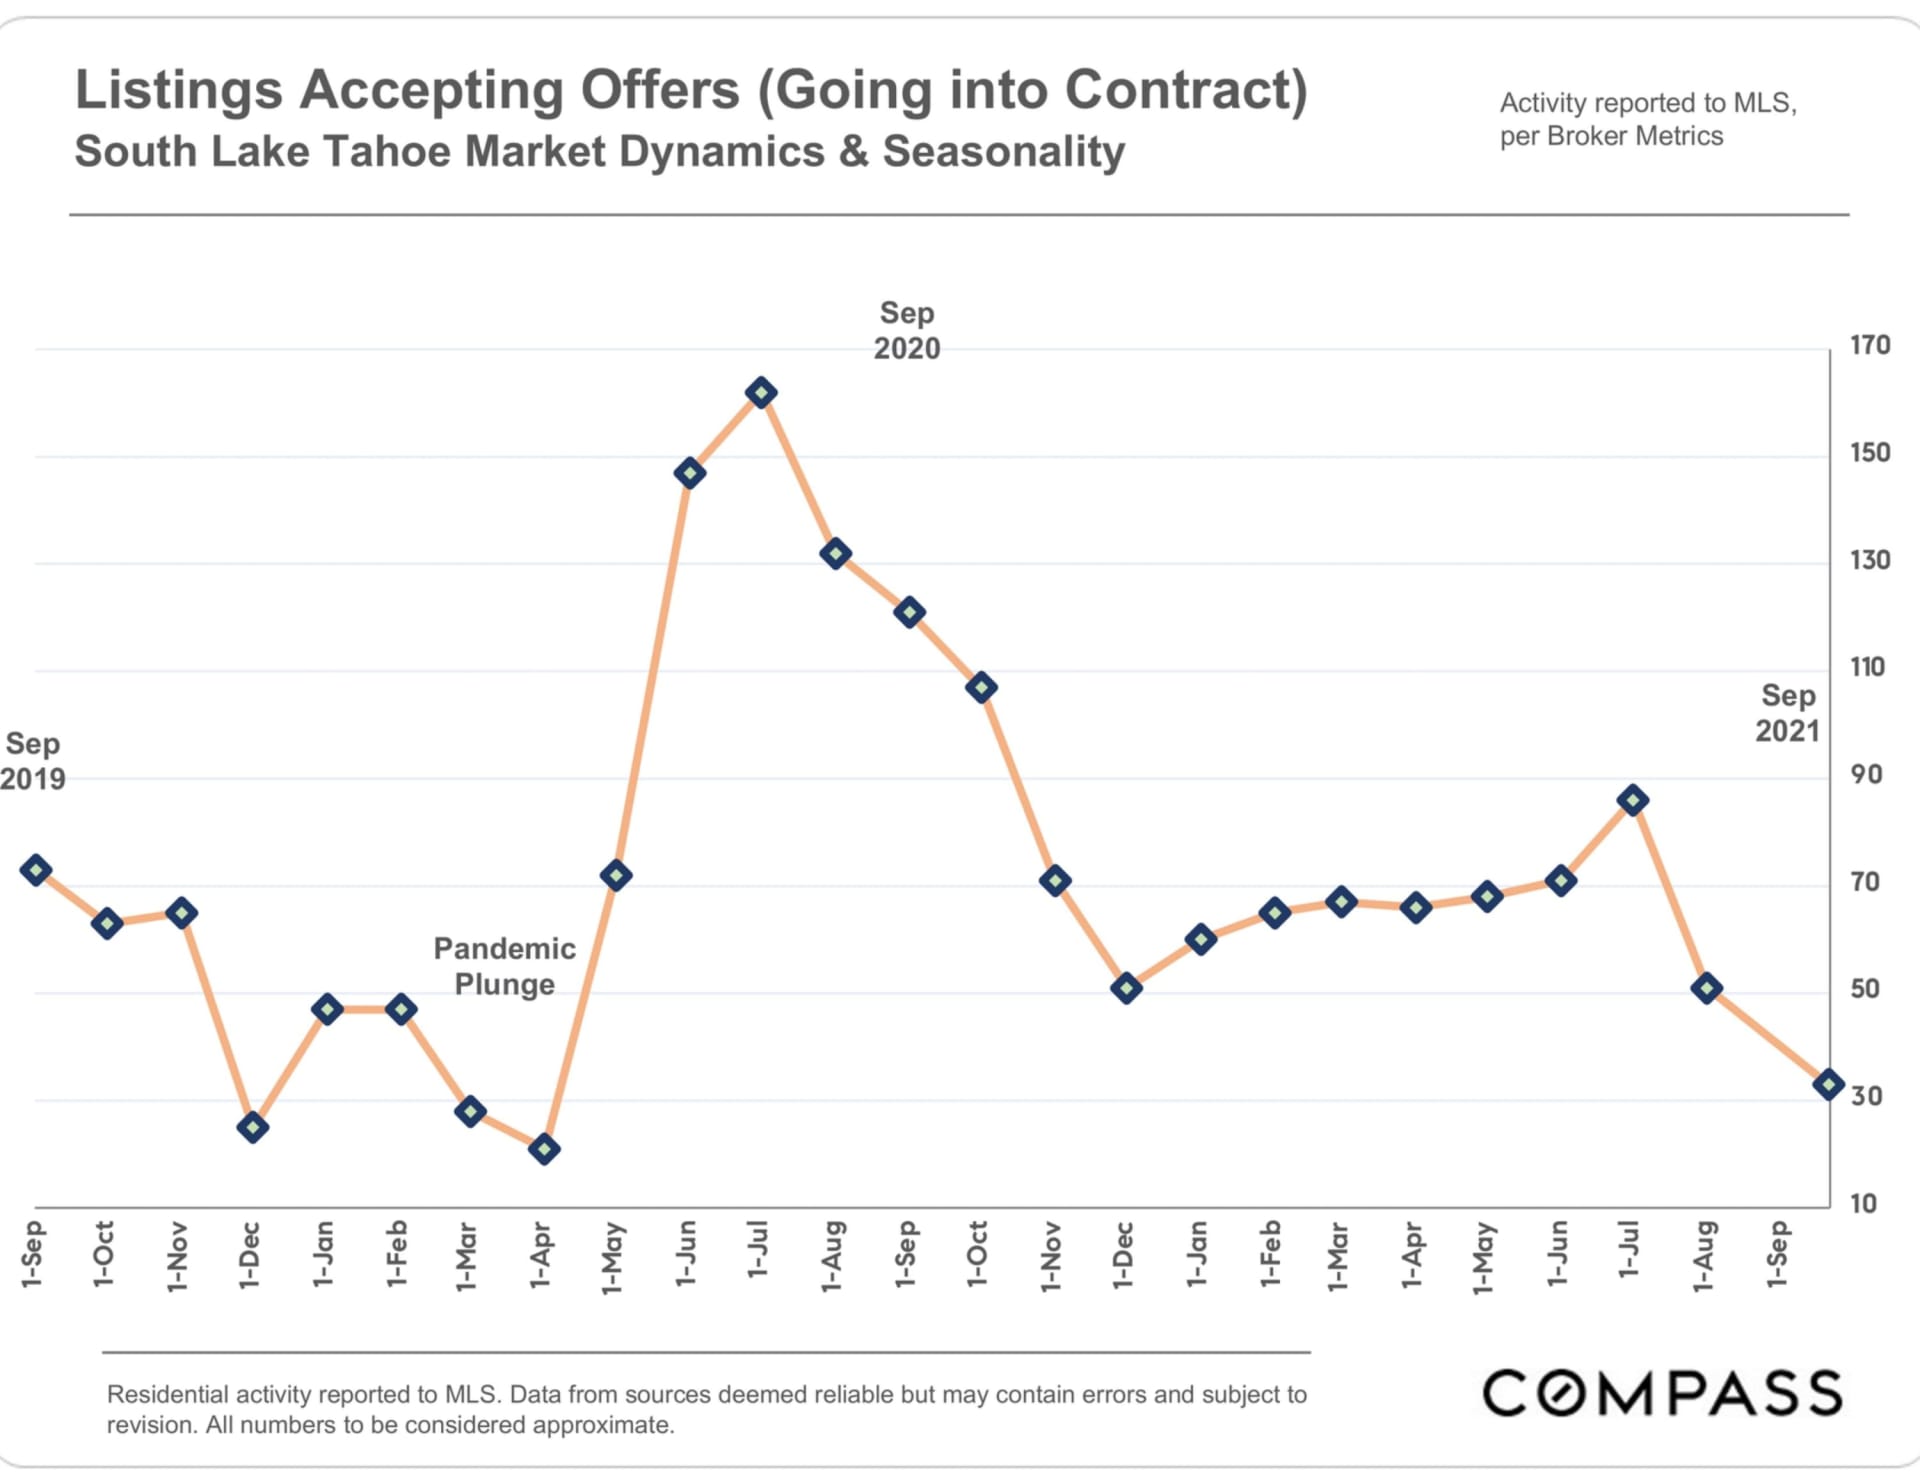
South Lake Tahoe chart of listings accepting offers, peaking in July 2020 before declining to September 2021.

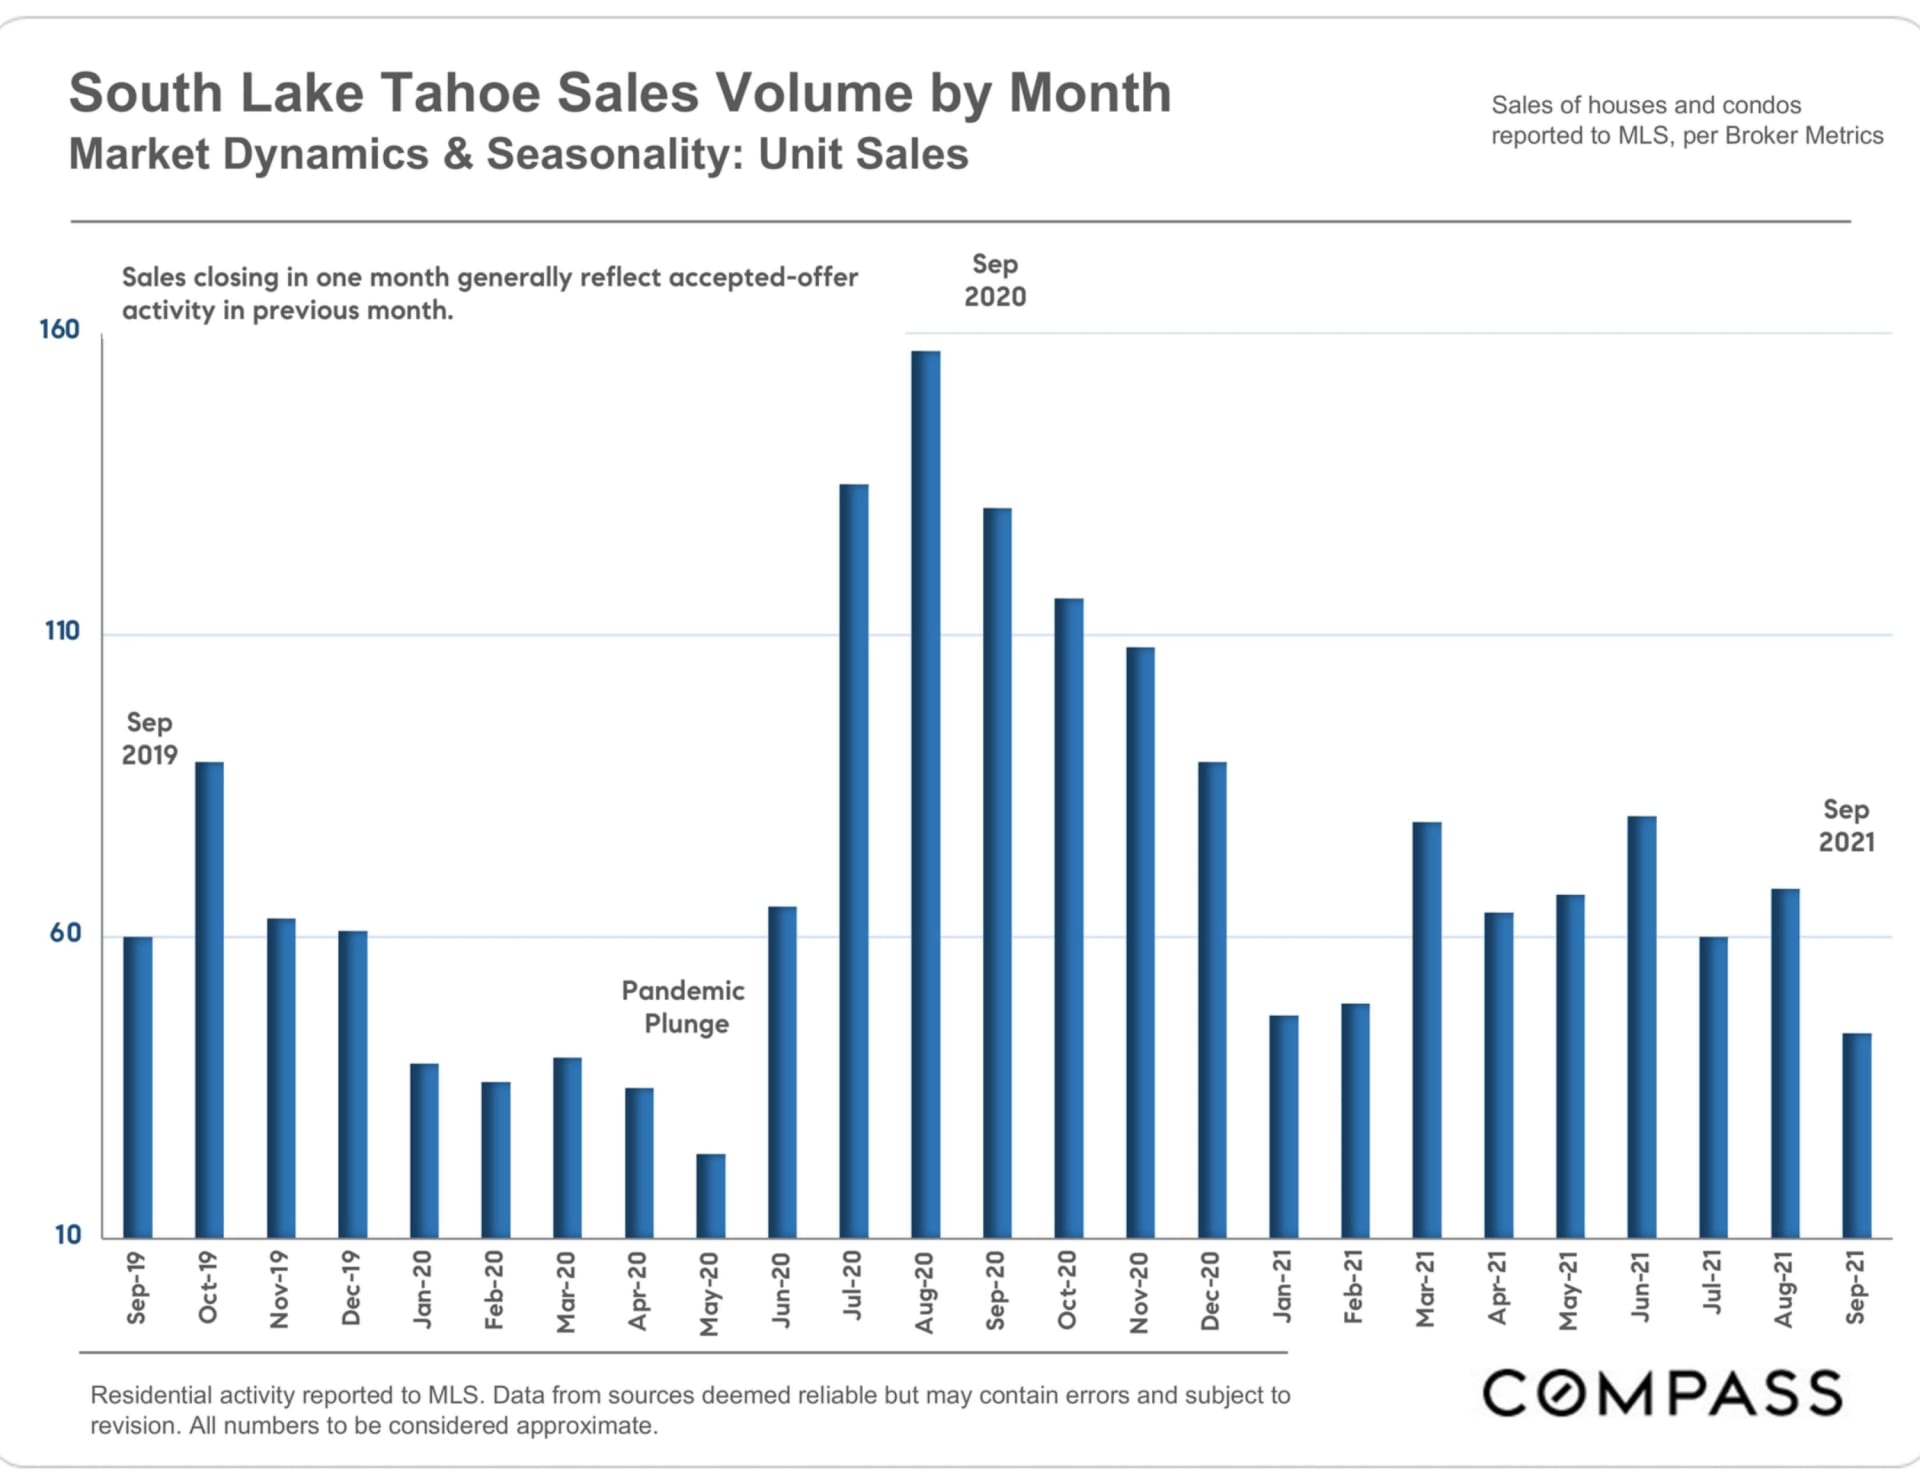
Bar chart of monthly South Lake Tahoe home sales, with a peak in August 2020 and a pandemic plunge in spring 2020.

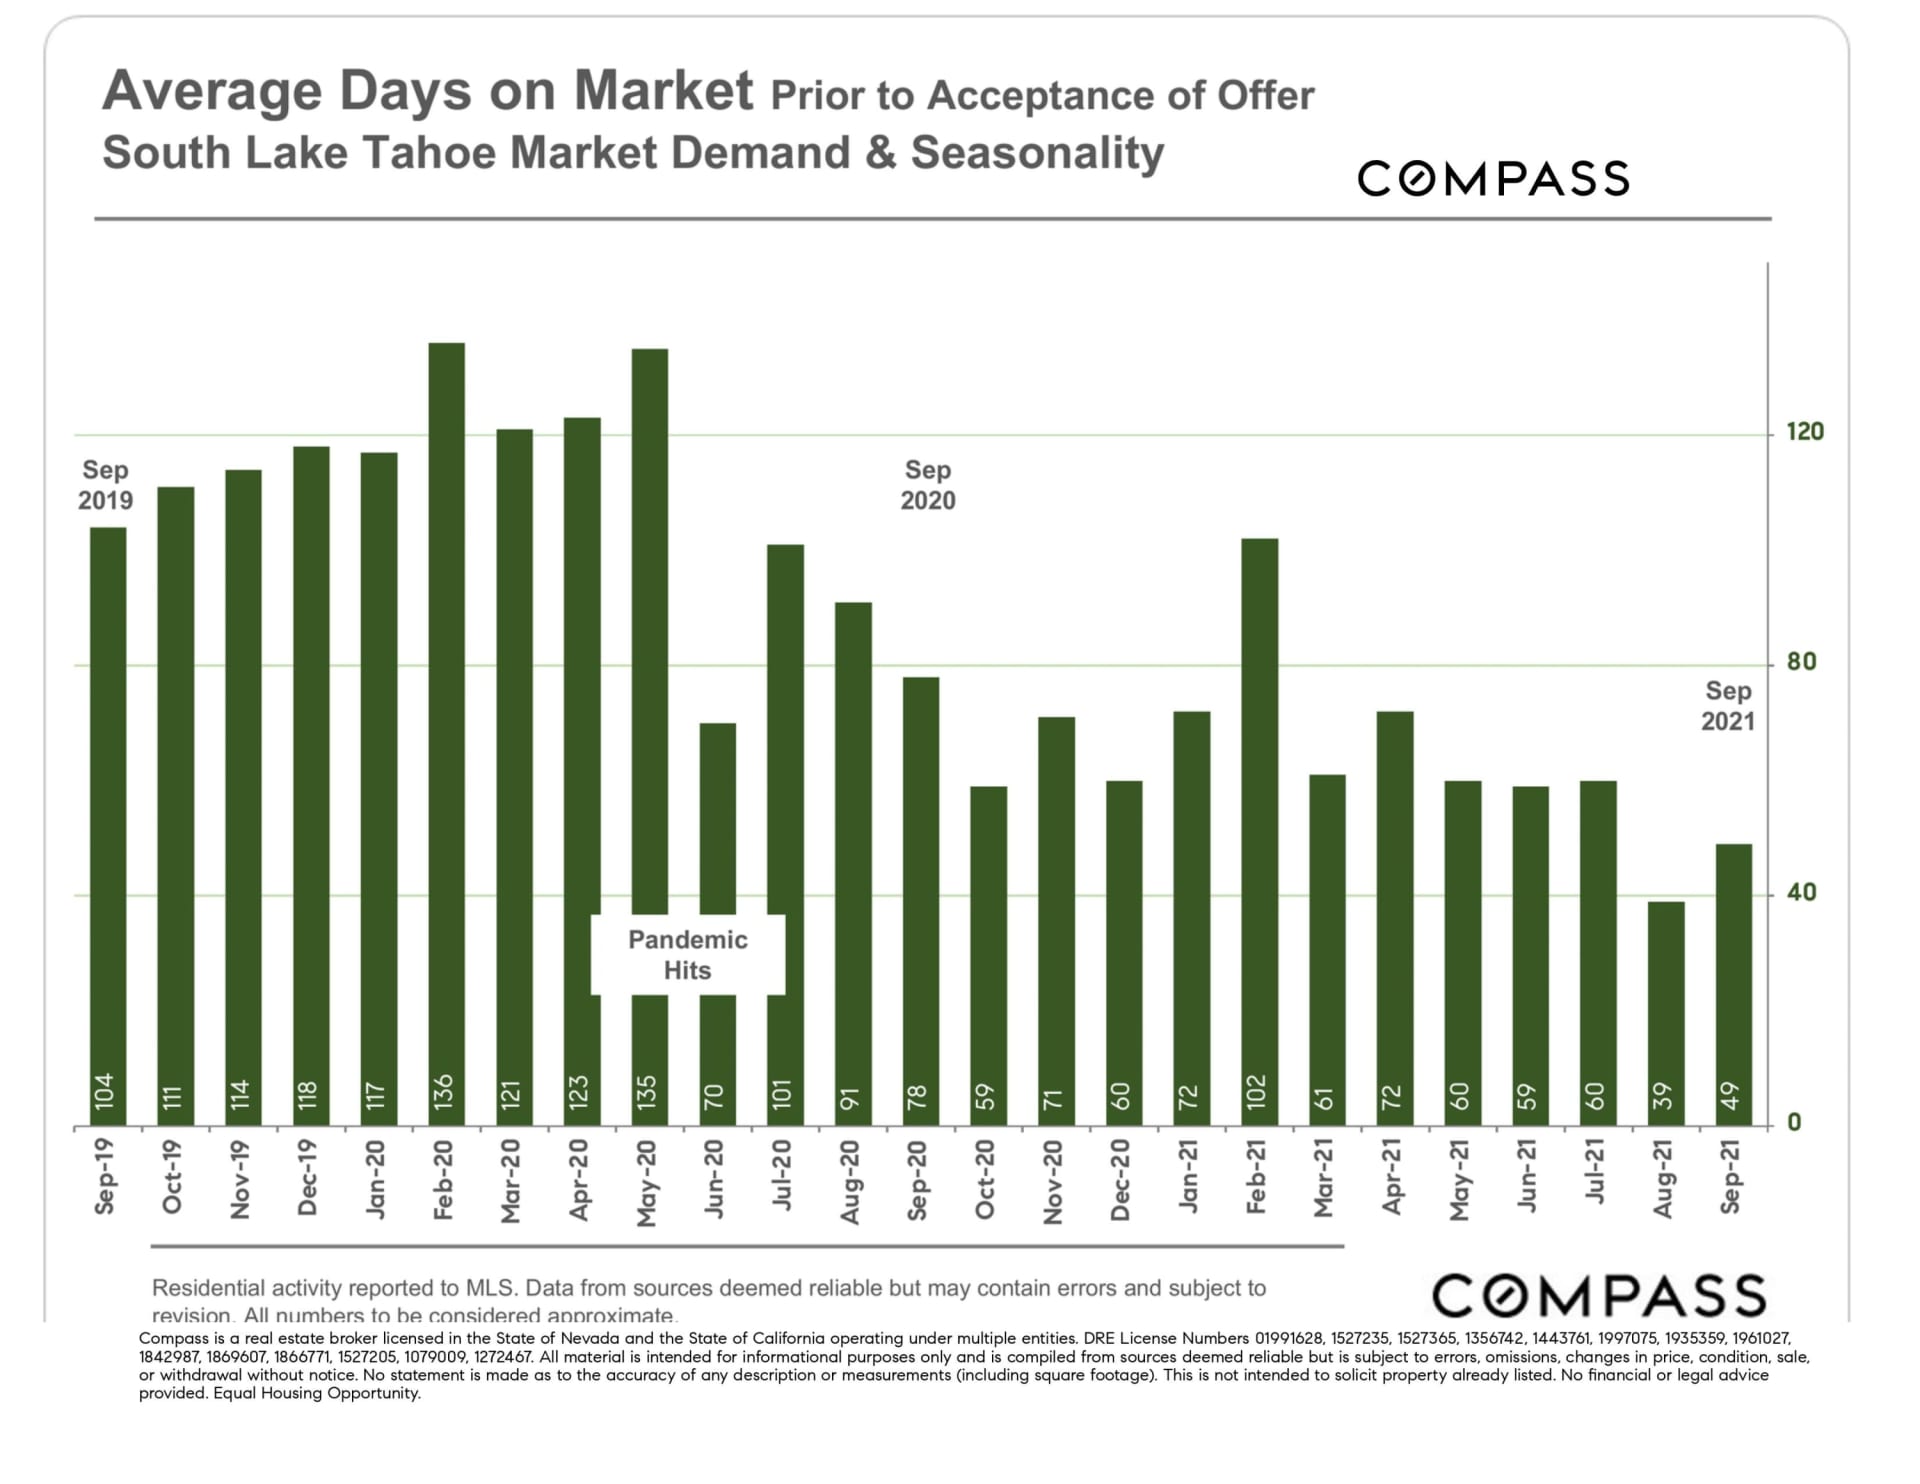
Bar chart of South Lake Tahoe days on market, declining from a February 2020 peak of 136 to 49 in September 2021.

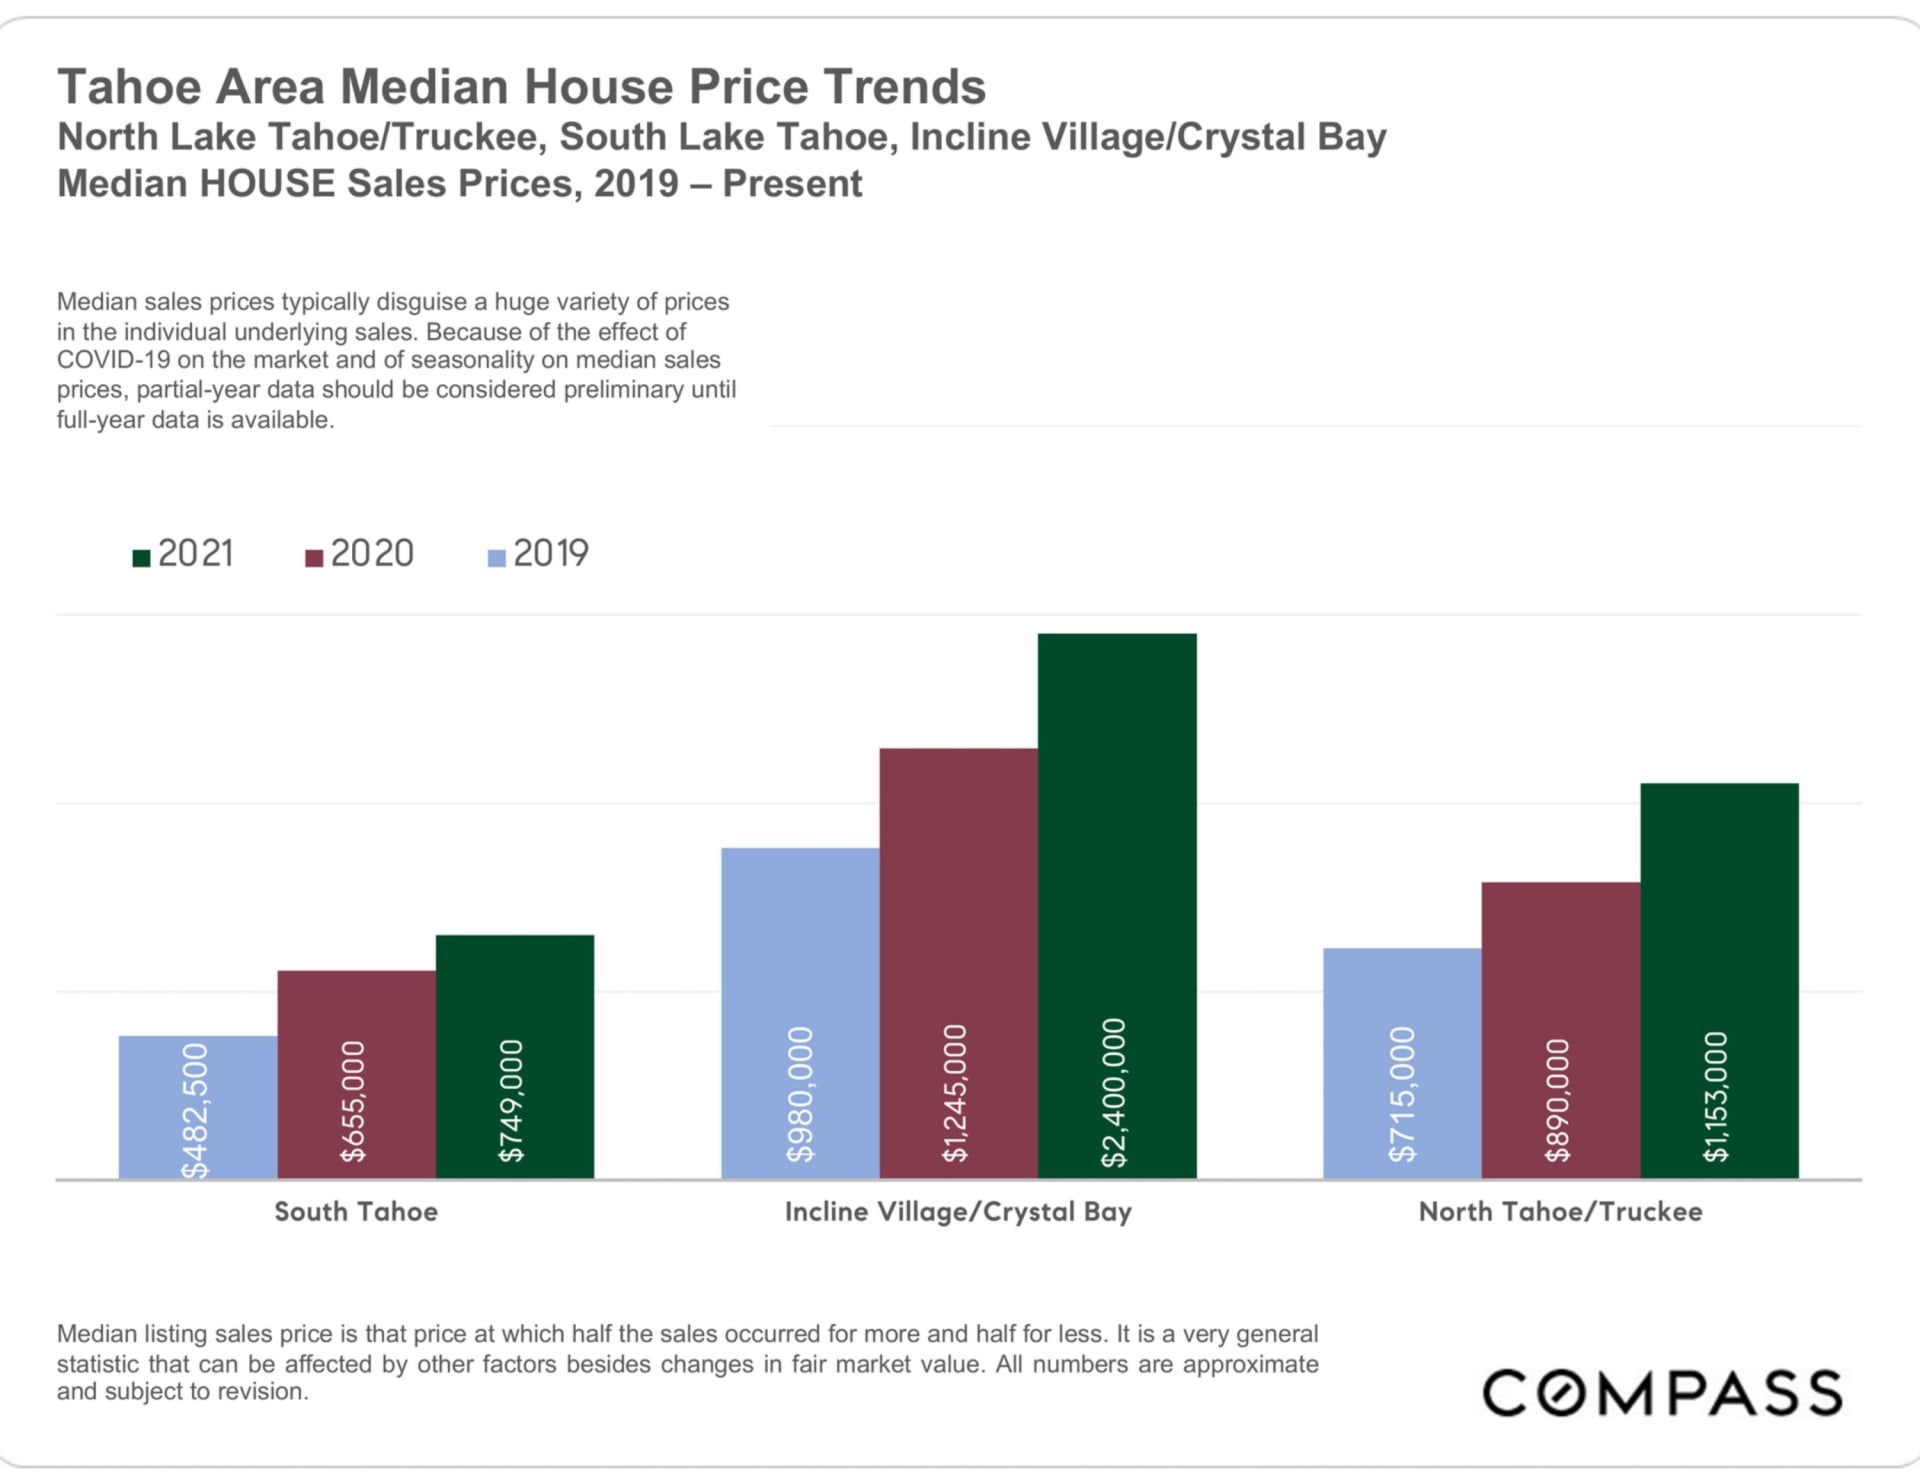
Bar chart compares 2019–2021 median house prices across three Lake Tahoe areas.

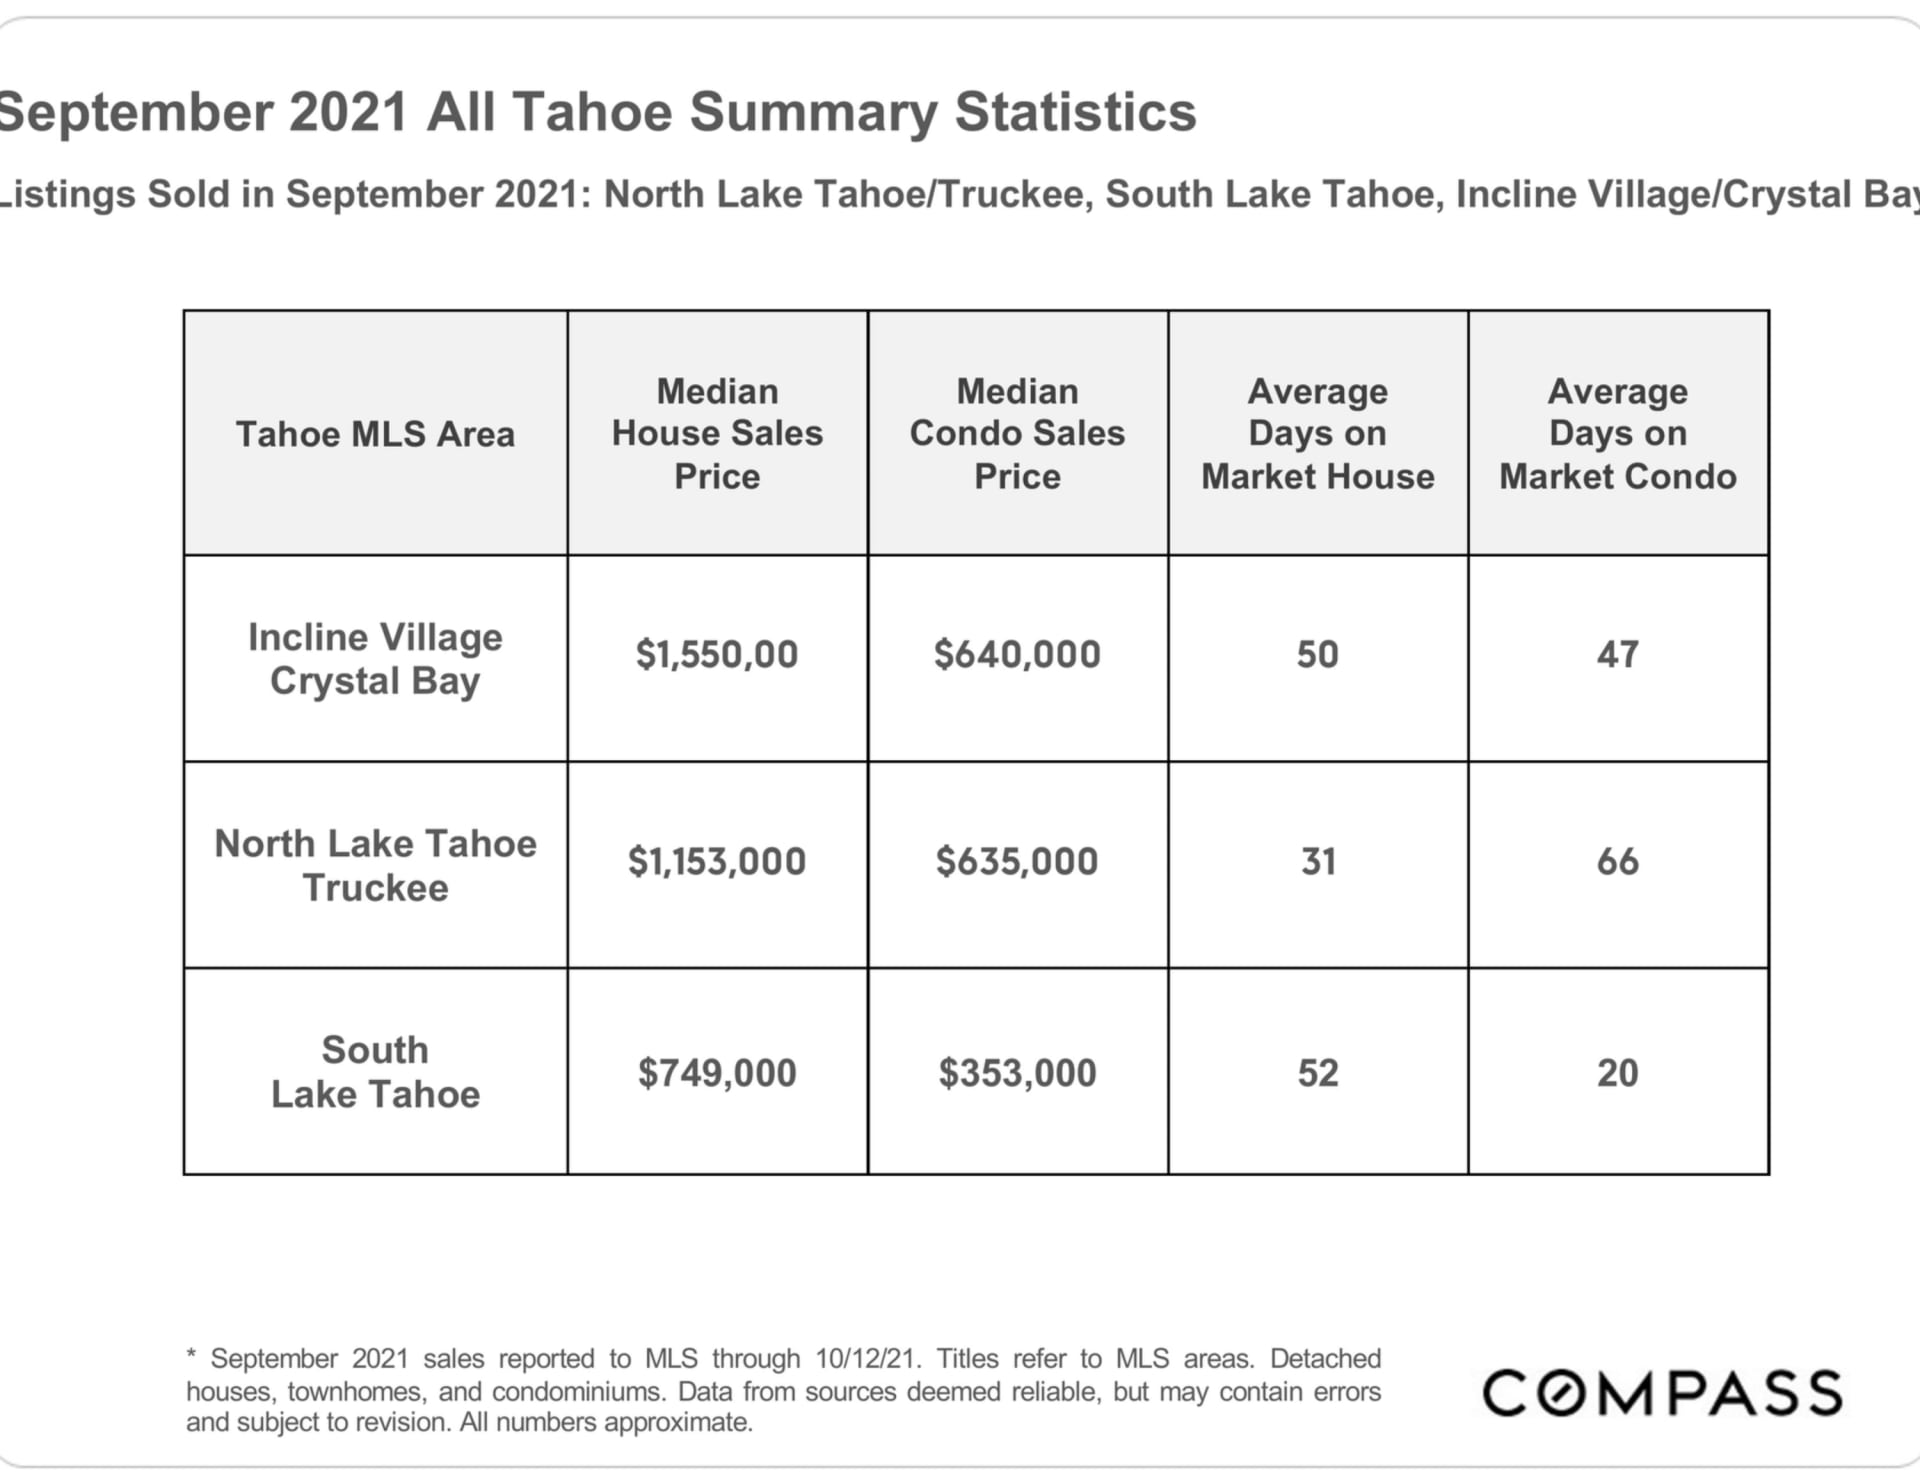
September 2021 Tahoe real estate statistics table comparing prices and days on market across three MLS areas.

Compass real estate report disclaimer, including broker licensing, information-use limitations, and liability notice.

Work With Us

Nothing is more important than Trustworthiness. In our world, integrity, competence, transparency and communication are foremost, at the time we begin our relationship together.
Contact Us
Follow Us